


Using Satellite Imagery For Housing Supply Estimates: A Beginner-Friendly Guide
Proper housing supply data is needed to make effective urbanplanning, housing policy, investment decision and social development.
Governments require this data so that they can plan infrastructure and allocate
resources, developers require it to determine market opportunities and
researchers use it to learn about growth and inequality patterns. However, in
most places, there is no, old, or completely no housing data. Conventional data
collection approaches that are utilized in the form of surveys, census and
administrative reports are very costly, time consuming and once per month,
particularly in the bustling fast changing urban areas.
The power behind an alternative is satellite imagery. The
development of earth observation technology has rendered high-resolution images
of cities and settlements very easy to access. These pictures enable analysts
to see the trends of housing development in large geographical locations, such
as informal settlements and peri-urban areas that are not usually recorded in
official documents. With modern tools of analysis, satellite imagery can be
used to give real-time and affordable estimates of the supply of houses.
The concept of satellite data application can be very
technical or frightening to novices. Nevertheless, a variety of tools, data
sets and procedures have become more easily accessible. Even non-experts can
develop informative knowledge about housing supply trends using simple and
thoughtful concepts and interpretation. It is all about knowing what satellite
photography can and cannot tell us and how to make good use of it.
The guide presents the basics of satellite imagery to
determine housing supply. It describes the usefulness of satellite data, how it
is possible to identify housing even out of space, what kind of imagery may be
obtained, and what pitfalls may be avoided. At the conclusion, the readers will
have a practical and clear idea of how satellite imagery could aid in a more
appropriate analysis of housing and the decision-making process.
Why Housing Supply Estimates Matter
The Housing supply is not an abstract figure, but it
determines actual results. In cases where the housing supply is
under-estimated, cities can end up not planning well in accordance to the
population growth, thus resulting in overcrowding, informal settlements, and
strain on infrastructure. In the event of overestimation, resources can be
allocated incorrectly and policies cannot solve the problems of affordability
or quality. Proper estimates also assist the policymakers to match supply and
demand, balance the housing markets and enhance livelihoods.
Housing supply data is in most countries based on building
permits, property registries or census records. Though these sources are
useful, they are usually behind the times. Building can be done without the
permission and particularly in the informal or low income districts. Census
data are only possible to be taken every ten years, which leaves out quick
development. Administrative data might not be accurate in terms of housing
quality, occupation, or vacancy.
Satellite imagery can be used to fill these gaps by giving a
consistent independent look at the built environment. Analysts are able to see
the locations of buildings, their density, and the growth in space, and how the
urban space develops over time. This especially comes in handy in rapidly
expanding cities where outdated data gathering methods are unable to keep up.
The broad variety of applications can be backed by housing
supply estimates based on satellite imagery. City planners are also able to
recognize those areas which are expanding faster and invest in infrastructure.
Informal settlements are able to be tracked and upgrading program can be
directed by housing agencies. The investors and developers are able to
determine the market saturation or opportunity. Patterns of inequality, sprawl
and land use change can be studied by the researchers.
The background of the importance of housing supply estimates
gives some insight into the usefulness of satellite imagery. It is not the
replacement of the traditional sources of data but rather it is the
complementary one particularly where there are gaps in data. Satellite imagery
can be used to make more informed and equitable and proactive decisions in the
housing landscape by enhancing visibility into the housing environment.
What Satellite Imagery Can Reveal About Housing
Satellite imagery is a visual data of the surface of the
earth which consists of buildings, roads, green cover and water bodies. In
housing analysis, imagery can be used to determine the location of structures,
their arrangement and their transformation as time progresses. This information
is even at the most simple level where it can be used to estimate the supply of
housing and the patterns of development.
Among the most direct applications of satellite images is
the determination of the built-up areas. Analysts are able to map the level of
urbanization by separating natural land cover and built surfaces. This assists
in estimating the extent of land use with housing and its spread outwards out
of city centres.
When the resolution is increased, it is possible to see
individual buildings. Analysts are able to count rooftops, approximate the area
of buildings and density. Although this is not a direct conversion to the
number of housing units, it gives a very close proxy particularly when
supplemented with assumptions on average household size or type of building.
Informal housing is one area that is best collected through
Satellite imagery. The informal settlements are usually formed in a hasty
manner and outside the official planning systems and hence are hard to follow
by administrative data. The space, nevertheless, allows viewing their peculiar
patterns with massive agglomerations, unusual designs, and the growth
throughout the years.
The other potent capability is temporal analysis. Using the
comparison of photos of various years, analysts could follow building,
demolition and growth of housing. This means that we have dynamic estimates of
supply instead of snapshots. What can be learned even by amateurs is that even
the simplest before-and-after comparisons can serve as valuable information.
Although the satellite images do show no ownership, legal status, or interior conditions, they offer a distinctive scaled view of the physical housing stock. To learn how to use it efficiently and safely it is necessary to know what it can disclose.

Satellite imagery is not uniform and knowing the general
types assists beginners to make the right choice on the data to use in
estimating housing supply. The very popular one is the difference between
low-resolution, medium-resolution and high-resolution images, each having its
own strengths and limitations.
Low-resolution images are widely scanned and can be made
without restrictions. It is applicable in the analysis of a region or country
level like monitoring urban development. Nonetheless, the individual buildings
cannot be seen and thus unsuitable in housing counts.
Medium-resolution images provide a compromise on the
coverage and detail. It may exhibit accumulated lands well and can mostly be
adequate to determine urban and rural lands use. Although each rooftop cannot
be singled out, there are patterns of densities and settlement demarcations.
The imagery of high quality presents the detailed images at
which individual buildings and even roof shapes can be distinguished. This is
the best detail to have in estimating the housing supply at the neighborhood or
city level. Data at high-resolution can be provided by commercial vendors or
specific open data, and it might be restricted and more expensive.
The next significant difference is in the optical imagery
and radar imagery. Optical imagery is visualization similar to photographs and
is easy to read. Radar imagery is not as well-known as a visual imagery but is
able to filter through clouds and can be employed in areas where clouds are
frequent. To novices, optical imagery is normally the simplest to start with.
Frequency of time is also an issue. There are satellites
that coverage revisit the same location at regular intervals hence near real
time coverage of an area and those with less frequent updates. To monitor the
changes in housing, it is important to select imagery with the right time
coverage.
Having knowledge about these simplified types, beginners
will be able to make quality decisions on the type of satellite imagery that
will best match their analysis of the housing supply requirements.
Identifying Housing Structures from Space
Housing structures can be identified in satellite imagery,
which is a science and art. On a fundamental level, housing is manifested
through groups of rectangular or polygonal structures with uniform size and
structures. Other clues may be given by roof contents, colour and shadowing.
Novices usually begin by looking into pictures in order to get acquainted with
the appearance of housing in various settings.
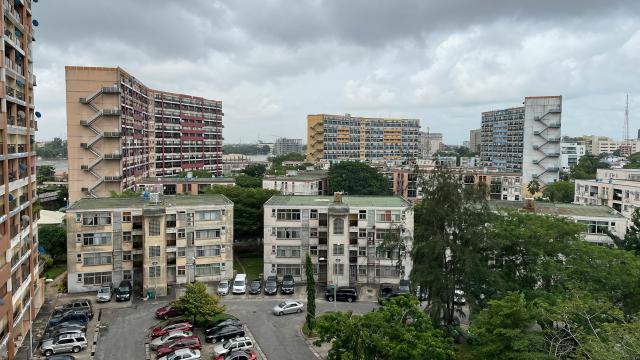
Planned urban areas may have regular patterns in housing,
the streets are straight and the buildings are of similar sizes. Conversely,
informal settlements usually are irregularly arranged, clustered at high
densities, and less massive. These differences are important to the analyst in
understanding the supply of housing better.
Manual identification: This is the process of identifying
buildings within a given area by counting them or marking them. Though
bypassed, this is an excellent method to use with limited-scale studies or
training. It assists novices to gain intuition and have local knowledge about
housing.
Automated techniques rely on computer algorithms to identify
buildings in terms of shape, texture and contrast. Although both of these
approaches require technical expertise, numerous platforms have become
user-friendly with tools that use pre-trained models. These tools are usable by
beginners without extensive knowledge of programming, and only require
validation and interpretation.
One should bear in mind that not every building is a
residential one. Such buildings as warehouses, schools, and commercial
buildings might look like houses when viewed upside down. Housing can be
differentiated by contextual information like location, size, and neighboring
features among other things.
Housing is something that takes time and practice to
determine. Simple tools and local expertise could allow beginners to come up
with meaningful housing supply estimates using satellite imagery by using a
combination of visual inspection and simple tools.
Estimating Housing Supply from Building Data
After identifying housing structures, the next thing is the
estimation of housing supply. The easiest method is the counting of buildings
or rooftops. This can be used to estimate the housing units in places where the
housing units are single family homes. In the case of buildings in multi-story
or multi-unit, there is a need to make more assumptions.
Another useful measure is the building footprint area.
Greater footprint can be a premise of multiple housing units or apartment
buildings. Analysts can estimate the number of units per structure by taking
footprint size and local information on building typologies.
Measurements of density also come in handy. Housing density
is ratio of units per hectare or buildings per square kilometer, which is used
to compare supply in regions. Density variations with time can reflect either
infill development or vertical expansion.
Vacancy estimation may also be done indirectly using
satellite imagery. A case in point, unfinished buildings or absence of access
roads patterns can indicate vacant housing or unfinished housing. These
indicators may be used in further analysis, even though they are not
conclusive.
One should recognize indecision. Housing supply estimates
based on satellite images are based on assumptions that are expected to be
mentioned. Sensitivity analysis, in which the various assumptions are put to
the test, enables one to have an idea of the range of possible outcomes.
In the case of beginner, the aim is not to start out with
perfection but to understand better. Even the rough estimates are very helpful
when the actual data is not available or old.
Beginner Tools and Platforms.
More and more tools are available to enable the beginner
with access to satellite imagery. Maps created on the Internet enable people to
inspect and examine the imagery without specific software. Certain sites
provide historical visuals, a measuring device and simple sorting
functionality.
Geographic information systems or GIS have more
sophisticated mapping and analysis capabilities. They need a certain amount of
learning, but numerous tutorials and resources that are user-friendly are
supported by the beginners. Open-source alternatives decrease obstacles to cost
and promote experimentation.
Cloud-based services provide highly analytical services
without the need of having local computing capabilities. Such platforms also
tend to provide ready-to-use datasets of satellites and user-friendly
interfaces to common tasks like land cover classification or building
detection.
Simple measurements and visualization should be used as a
starting point by beginners. When the confidence increases, more sophisticated
tools may be investigated. The trick is to select the tools according to the
level of skill and to the objective of the project and not to seek the
complexity as an end to an end.
The primary obstacle is no longer access to the tools, but
how to use them in a wise way. Novices can train and learn to be of practical
use in housing analysis based on satellite images within a short period of time
and curiosity.
Limitations and Ethical Issues.
Although satellite imagery is a potent instrument, it has
significant constraints. It displays physical structures but not social, legal,
and economic statuses. It is not able to tell who resides in a building,
whether it is affordable or whether it is safe. It would be a mistake to stick
to imagery only.
Resolution limits may cause misclassification or
undercounting and this is particularly in dense or vertical housing. Structures
may be obscured by cloud cover, shadows and image quality. Quick building or
demolition may be missed due to gaps in time.
Ethics is also a major concern. Unofficial communities and
the less fortunate can be revealed through satellite images. Data should be
used in a responsible manner in order to ensure that the insights are utilized
to empower inclusion and improvement as opposed to surveillance and
displacement by analysts.
The concept of privacy, though not as direct as in the case
of street-level imagery, is relevant. The risks are reduced by aggregated
analysis and anonymized reporting. Good communication of ways and motives
generates trust.
Knowing limitations and ethics assist beginners not to be
overconfident and abusive. The use of satellite data is best in collaboration
with ground data, local input, and policy framework.
Conclusion
Satellite imagery has also revolutionized the process of
estimating the supply of homes particularly in data-limited and fast-altering
settings. To the newcomers, it provides an easy introduction to spatial
analysis and housing studies. The satellite imagery, being able to make timely,
scaled and independent measurements of the built environment, supplements
traditional data sources and improves the understanding.
This guide has demonstrated that one does not necessarily
need high-level technical skills when using satellite imagery. Simple tools and
a good interpretation of simple concepts allow novices to produce valuable
insights into trends in housing supply. The applications are comprehensive in
determining the buildings, estimating the density and giving an idea of how the
city will look in future.
Meanwhile, during responsible use, it is both essential to
be conscious of restrictions, assumptions, and even ethical implications.
Satellite pictures are a strong prism, yet no full-fledged picture. It is best
when used in conjunction with other data and local knowledge.
With the growth in technology and the availability of access, satellite imagery will become even more significant in the housing analysis and policy. To the newcomers, knowing how to use this tool would enable them to view cities in new perspectives of the challenges facing housing and become part of the more informed and fair decision-making.
Also Read: How Rising Construction Costs Are Shrinking India’s Affordable Housing Supply

-5yCS4OoVBg.jpg)













LEAVE A REPLY