
Measuring Financial Inclusion: Explaining Variation Across and Within Countries
Introduction
Measuring financial inclusion is more than an academic exercise—it’s a vital step toward building equitable, resilient, and dynamic economies. At its core, financial inclusion means that individuals and businesses—especially the poor, women, rural populations, and other marginalized groups—can access and use affordable, appropriate, and timely financial products and services. These include savings accounts, credit, insurance, and payment systems. Yet despite global progress, billions remain excluded.
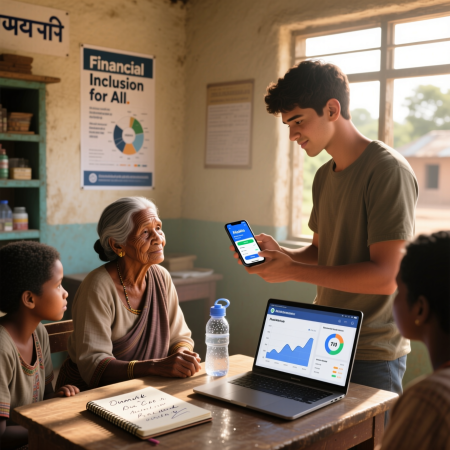
Understanding why inclusion levels vary so dramatically across and within countries requires robust measurement, nuanced data, and contextual awareness. This summary explores how we go about measuring financial inclusion, the key indicators used, the drivers of variation, and what these insights mean for policymakers, financial institutions, and development actors worldwide.
What Is Financial Inclusion—and Why Measure It?
Financial inclusion is not just about having a bank account. It’s about meaningful access: Can a farmer get crop insurance? Can a street vendor borrow small capital to expand? Can a woman in a remote village send money to her family safely and cheaply? Measuring financial inclusion helps answer these questions by tracking who uses financial services, how they use them, and whether those services meet their needs. Without measurement, efforts to expand inclusion risk being misdirected, inefficient, or even exclusionary. Reliable metrics allow governments to design targeted policies, banks to develop inclusive products, and donors to allocate resources effectively. In short, you can’t improve what you don’t measure—and measuring financial inclusion is the foundation of inclusive growth. Key Dimensions of Financial Inclusion Experts agree that measuring financial inclusion must go beyond simple access. The most widely accepted framework includes three interrelated dimensions:- Access: Physical and digital proximity to financial infrastructure (e.g., bank branches, agents, mobile money).
- Usage: Frequency and depth of service use (e.g., number of transactions, loan uptake, savings behavior).
- Quality: Affordability, transparency, consumer protection, and suitability of products.
Global Tools and Databases for Measurement
Several global initiatives provide standardized data for measuring financial inclusion:- World Bank’s Global Findex Database: Conducted every three years, it surveys over 150,000 adults in 140+ economies on how they save, borrow, make payments, and manage risk. It’s the gold standard for cross-country comparison.
- IMF’s Financial Access Survey (FAS): Compiles supply-side data from central banks on bank branches, ATMs, and account penetration.
- Findex +: Integrates Findex with geospatial and mobile data to reveal disparities within countries.
- UNCDF’s MAP (Making Access Possible): Focuses on least-developed countries with granular national diagnostics.
Explaining Variation Across Countries
Why does financial inclusion look so different in Kenya versus Pakistan, or Sweden versus Nigeria? Several macro-level factors explain cross-country variation:- Regulatory Environment: Countries with supportive regulations—like tiered KYC (Know Your Customer) rules, agent banking laws, and fintech sandboxes—see faster inclusion. India’s Aadhaar-based e-KYC and Kenya’s early embrace of mobile money are prime examples.
- Infrastructure and Technology: Mobile phone penetration is a powerful enabler. In Sub-Saharan Africa, mobile money has leapfrogged traditional banking, driving usage even where banks are scarce.
- Economic Development: Higher GDP per capita generally correlates with greater inclusion—but not always. Rwanda and Bangladesh show that strong policy can drive inclusion even in low-income settings.
- Gender Norms and Social Structures: In many countries, cultural barriers limit women’s access to ID, phones, or independent financial decision-making—creating persistent gender gaps in inclusion metrics.
- Financial Sector Structure: Economies dominated by a few large banks may underserve rural areas, while those with diverse providers (cooperatives, microfinance, fintechs) often achieve broader reach.
Explaining Variation Within Countries
Even more striking than differences between nations are the disparities within countries. Urban-rural divides, gender gaps, and income-based exclusion are common:- In India, urban account ownership exceeds 90%, while rural rates lag near 70%—despite national schemes like Jan Dhan Yojana.
- In Nigeria, only 26% of women have bank accounts compared to 43% of men, reflecting legal and social constraints.
- In Brazil, the Amazon region has far fewer bank branches per capita than São Paulo, limiting access despite national progress.
The Role of Digital Financial Services (DFS)
Digital innovation has transformed measuring financial inclusion. Mobile money, e-wallets, and digital credit have expanded access faster than traditional banking ever could. In 2021, the Global Findex reported that 76% of adults in Sub-Saharan Africa made a digital payment—up from 34% in 2014. However, digital access doesn’t guarantee inclusion. Without digital literacy, reliable connectivity, or consumer safeguards, DFS can exclude the elderly, illiterate, or ultra-poor. Thus, modern measuring financial inclusion must also track digital readiness, usage patterns, and risks like over-indebtedness from algorithmic lending.Challenges in Measuring Financial Inclusion
Despite advances, measuring financial inclusion faces significant hurdles:- Data Gaps: Many countries lack recent or representative surveys. Informal finance (e.g., ROSCAs—rotating savings groups) is rarely captured.
- Inconsistent Definitions: What counts as “active use”? Is one transaction per year enough? Lack of standardization complicates comparisons.
- Overreliance on Access Metrics: Policymakers often celebrate account numbers while ignoring usage or quality.
- Privacy and Ethics: Collecting granular financial data raises concerns about surveillance and data misuse, especially in authoritarian contexts.
Beyond Numbers: Measuring Impact and Outcomes
True inclusion isn’t just about service uptake—it’s about improved livelihoods. Does access to savings help households withstand shocks? Does credit boost small business growth? Leading researchers now advocate for measuring financial inclusion alongside outcome indicators:- Resilience to economic shocks
- Women’s economic empowerment
- Small enterprise revenue growth
- Reduction in poverty or inequality
Policy Implications: From Measurement to Action
Robust measuring financial inclusion directly informs better policy. Examples include:- India: Used Findex data to target last-mile banking through business correspondents.
- Mexico: Launched CoDi (digital peso) after identifying low digital payment usage.
- Rwanda: Partnered with telecoms to expand mobile money in rural areas based on usage gaps.
The Future of Measurement: AI, Big Data, and Real-Time Monitoring
Emerging technologies are revolutionizing how we approach measuring financial inclusion:- Alternative Data: Mobile call records, utility payments, and satellite imagery can proxy financial behavior where surveys are lacking.
- AI-Powered Dashboards: Real-time dashboards (e.g., by the World Bank or CGAP) now visualize inclusion trends down to the district level.
- Blockchain Analytics: Can trace usage of decentralized finance (DeFi) services, though still niche.