

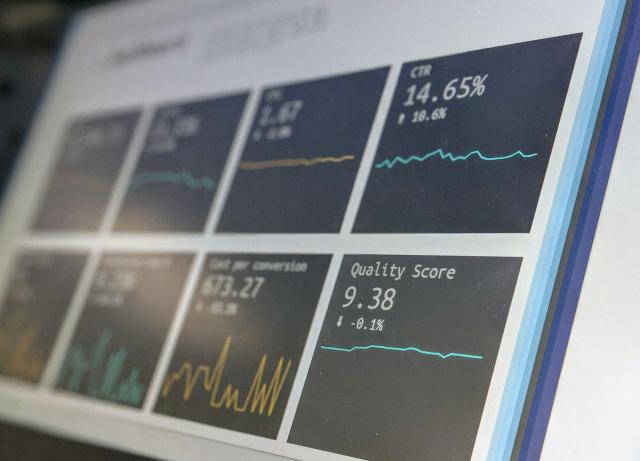
Creating A “Housing Affordability Dashboard” For A City
Affordability of houses has become one of the most acute urban issues in the modern world. The increasing rents, frozen incomes, low housing supply, and inequality in the distribution of services have begun to place a lot of households in financial distress.
However, even though the magnitude of the issue is high, not every city can keep track of the affordability in a transparent, consistent, and practical manner. There is information, but it is usually spread across the departments, is too old, or is provided in the form that is not understandable to both decisionmakers and the general population.
Such a gap between the availability and usability of data
undermines policy responses and undermines trust in people.
A housing affordability dashboard can provide a strong solution. By aggregating all major indicators into one transparent and frequently updated site, cities can monitor affordability, gauge the effect of policies, and communicate effectively with the citizens.
An effective dashboard design does not have to be sophisticated or costly. Plainness, simplicity, and pertinence are much important than the sophisticated analytics. It is not aimed at overloading the users with information but rather a common ground of facts on which informed decisions can be made.
This blog is a simple, applied template of the dashboard of
housing affordability at the city level. It deals with what to quantify, the
way information has to be organized, and how the dashboard can stay helpful
over time. It provides ways in which cities can be prepared to design
dashboards to enhance planning, greater accountability, and more equitable
housing outcomes, without advanced technical capability or high budgets in nine
core components.
Established Purpose and Audience of the Dashboard
The greatest fallacy on the development of housing
dashboards is not beginning with a purpose but with data. A dashboard that
makes an attempt to serve everyone well usually serves no one well. A city
needs to be very clear on why the dashboard is created and to whom it is
addressed before choosing indicators or creating visuals. Presentation is
dictated by audience and scope is dictated by purpose.
A dashboard on housing affordability can be used by a
variety of audiences such as policymakers, planners, housing agencies, civilsociety organizations, journalists and residents. Nonetheless, the groups
employ different forms of information. The policy makers require brief
indicators that assist in budgetary and regulatory decisions. Space and trend
information is required by the planners to drive land-use plans. The citizens
desire to have clear answers to their questions on how affordability is evolving
and its significance to them. Trying to meet all the needs to the same degree
of detail may be confusing.
Explaining the main audience will enable cities to make
simplicity a priority. A decision-maker dashboard can be interested in a few
high-level indicators that are updated every quarter. A user-welcoming
interface can have contextual descriptions and time-to-time comparisons.
Notably, the dashboard cannot be viewed as a technical reporting tool per se,
but rather as a communication tool that can create a common ground of
understanding of housing conditions.
The definition of success is also defined by purpose. Does
the dashboard aim to monitor stress of affordability, measure policy
interventions, and spot inequities or promote transparency? The failure of many
dashboards is due to the existence of the dashboards without a specific role in
the policy process. A clear purpose will make sure that the dashboard will be
used to make real decisions and not an inert statistics warehouse.
Choice of Core Affordability Indicators
The main indicators at the center of any housing
affordability dashboard are a small number of core indicators that reflect the
reality that households live in. It is not the problem of where to find data,
but in what measures to use the right measures. There are too many indicators
that blur attention, and those that are not carefully selected incorrectly
depict the affordability factors. A basic dashboard must be more focused on
clarity than in comprehensiveness.
The housing cost burden is the most commonly used
affordability measure, and is generally described as households paying above 30
percent of their income to housing. The moderate cost burden measures are
included together with the severe cost burden measures as they assist in
defining stress and crisis. Rent to income and price to income ratios are
complementary views of what happens in the market, especially when monitored
over time.
But affordability is not confined to the cost of housing
only. Equal importance is given to income distribution. The median household
income, trends in income growth and sector-by-sector wage data are included and
aid in setting the affordability pressure context. Income data is missing,
which means that increased rentals can be seen as less threatening or more
threatening than they are.
Supply-side indicators also are very important. The tenure
mix, housing completions, and vacancy rates can tell whether the lack of
affordability is influenced by the lack of supply or high demand. Segregating
affordable housing inventory with market-rate units aids the cities in
evaluating policy interventions to reach the target population.
A basic dashboard must not be tempted to show as many
metrics as possible. Every indicator must be responding to a clear question: Is
housing more or less affordable? For whom? And why? With correct choice of
indicators, the dashboard can become a storytelling tool that can be told in a
coherent story but not a technical spreadsheet displayed visually.
Breaking Data Down to expose Inequities
Averages in the city may conceal abysmal inequalities. A
housing affordability dashboard which reports aggregate figures only runs the
risk of neglecting communities which are the most compromised by housing
stress. Disaggregation is thus necessary not to confuse the dashboard, but to
make it closer to the truth.
The most intuitive point of departure is the geographic
disaggregation. Local data on the neighborhood level show spatial
affordability, pressure of displacement and investment in housing. Even
breakdowns as simple as those at the ward or district level will reveal some
stark contrasts that are not revealed by citywide indicators. The concept of
mapping the affordability measures enables the policy makers to be more
specific with the interventions.
Disaggregation according to income is very significant as
well. This is indicated by the monitoring of the affordability in relation to
income quintile and identifies both those being priced out and those being
insulated. This is important information that can be used to gauge if the
housing policies are advantageous to those with low and middle income or are
only beneficial to those with higher income levels.
Demographic disaggregation further complicates this.
Structural inequities relying on housing markets are usually evident in
differences in age, household type, race, or migration status. Although cities
should be careful with data privacy and interpretation, it is possible to
inform more equal policy responses with the presentation of aggregated
demographic patterns.
Different disaggregation do not require a dashboard to be
shown at the same time. Rather, it can enable users to switch between views or
put a priority group or two into focus. The key is intentionality. The
inequities should be shed light on through disaggregation, rather than
overwhelm the users.
Upon the disaggregation of cities in a prudent manner, dashboards evolve into accountability, rather than monitoring. They render visible that it is the poor who suffer because of housing systems and expose pressure to find more inclusive solutions.

Combining Supply, Demand and Policy Data
The result of the supply, demand, and policy is
affordability. The use of dashboards that only concentrate on prices or rents
does not give a full picture. These dimensions are simply combined in a
dashboard that is easy to use yet able to explain not only what but why
something is going on.
The housing system responsiveness is indicated by supply
indicators like housing permits, completions and land availability. The
consistent issues of affordability are associated with slow or incompatible
increase in supply. Even simple supply measures will aid in the diagnosis of
structural constraints.
The contextualization of price pressures is based on
demand-side factors such as population growth, household formation, and
migration patterns. The result of high demand rates with low supply rates is
almost inevitably the case causing an affordability challenge. In the absence
of the demand data, the policymakers can attribute price growth to speculation
or construction costs only.
Indicators of policies complete the circle. Following the
progress of delivery of public housing, the results of inclusionary zoning,
housing subsidies, and housing rent stabilization coverage entails correlating
the outcomes of affordability with government intervention. This allows the
cities to determine whether the policies are scaling in the right direction and
producing quantifiable value.
It is not intended to assess the effectiveness of the policy
exhaustively in the dashboard, but to provide the connection of outcomes to
levers. With the deterioration of affordability, the decision-makers would be
able to visualize whether the supply stagnated, demand increased, or policy
interventions were delayed. This combined view turns the dashboard into a
diagnostic tool as opposed to a descriptive tool.
Learning to create Unambiguous Illustrations
Even quality data becomes worthless when it is unpackaged.
Visual design is not a post-sale aesthetically added feature; it is the gist of
the efficiency of a housing affordability dashboard. It must be clear,
consistent and restrained.
Instead of complex visualization, simple charts, such as
line graphs to display trends, bar graphs to show comparisons and maps to
display spatial patterns are frequently more effective. Every chart must
respond to one question and they must have clear labels, timeframes and units.
Having too many annotations or more than one axis per visual makes it harder to
comprehend since it overloads the visuals.
Color choices matter. Having similar color patterns in
indicators is beneficial in that the user would pick the patterns easily. The
use of thresholds, including affordability thresholds, gives an immediate
context without interpretation. The attention should be guided by some visual
cues, rather than distracted by such.
Availability is as well as significant. The dashboards are
to be readable across various devices and be comprehensible to users with no
technical knowledge. Usability is enhanced through clear titles, concise
explanations and glossaries. Dashboards are inclusive because they have
accessibility standards, such as color contrast and support of screen readers.
A plain template is a functional one that is not
sophisticated. It is not about showering design gems but to convey knowledge
easily. Intuitive visuals make dashboards a medium of communication, as opposed
to reporting.
Assuring Data Quality, Frequency and Transparency
A public dashboard is based on trust. In case users doubt
the accuracy of the data, its timeliness, and credibility of the source, the
dashboard becomes invalid. The quality of the data and its transparency should
be the priority of the cities, therefore.
Transparency in documenting the source of data, frequency of
updating data, and methodology creates trust. The users should be aware of the
source of the data, its frequency of changing, and the restrictions associated
with it. This does not involve any protracted technical commentaries but brief
explanations that can be understood by the non-experts.
The frequency of update must be reasonable and timely. Some
indicators might not be realistic with monthly updates, and annual updates
might not be effective due to the need to monitor them. When a basic dashboard
is utilized, frequencies can be put together, and each indicator is marked with
its own update period.
Stability in the long term is important. There is no
justification to alter the definitions or methodologies without clarification
which negates trend analysis. Dashboards ought to identify the breaks in series
well when there has to be a change in a series so that it is not confused.
Transparency also involves the recognition of gaps in data.
No city has perfect data. Clearly stating limitations will increase credibility
and collaboration with researchers, civil society, and residents to create
better coverage in the long run.
Integrating the Dashboard in Policy and Planning Process
There should not be a housing affordability dashboard left
alone. It is valuable based on its extent of integration within policy and
planning processes. Dashboards not linked to making decisions will soon be
unused or outdated.
The leadership of the city must clearly use dashboard
indicators as a connection to policy goals, reviews of the planning, and budget
conversations. The dashboard becomes institutional when the affordability
metrics are used to inform housing policies, zoning policies or housing subsidies
distributions.
This interlink age is supported by periodic reporting
cycles. It is advisable to present dashboard updates to city councils, housing
boards or planning commissions to make sure that data leads to deliberation.
This eventually becomes normalized evidence-based decision-making.
Cross-departmental coordination can be also supported by
dashboards. The transport, the land use, the social services and the economic
development affect the housing affordability. A common data platform will
promote convergence among agencies who would have otherwise worked in silos.
Placing the dashboard within the governance processes will
make it a tool of action and not observation. In the event that data influences
decisions, dashboards serve their role.
Involving the Public and creating Trust
The housing policy trust to the population is not always
strong and often depends on personal experience and not on figures. This gap
can be addressed through a well-designed affordability dashboard into making
information available, transparent, and relevant.
Data dashboards to the general population must have
contextual explanations that explain the data in real-life consequences. It is
useful to explain what the affordability thresholds entail on the household
budgets to enable residents be able to correlate statistics to their lives.
The involvement does not stop at publication. Dashboards can
serve as a centre of consultation, workshops, and feedback to the citizens of
the cities. Residents can be invited to interpret and respond to data and this
will create a sense of ownership of housing issues.
Notably, dashboards are not to be applied as an excuse to do
nothing. Transparency has to go hand in hand with accountability when
affordability becomes bad. The open communication must take into account the
difficulties and describe the intended actions.
When inhabitants understand that information is a reality
and it leads to action, they get trust. Not only is the dashboard a platform of
civic dialogue, but also an informational asset.
Conclusion
The process of developing a housing affordability dashboard
is not technical in nature; it is a governance decision. A simple, considered
dashboard can be used as a very strong instrument in comprehending the issues
of housing, making policy and gaining a sense of trust among the populace. It
converts complicated dynamics into collective knowledge and makes decisions
based on evidence and not intuition.
An effective dashboard begins with a purpose, targets
meaningful indicators, unveils inequity, combines supply and demand, and is
communicative, and transparent and sustainable. Last but not the least, it is
action-oriented. Statistics cannot resolve the affordability crises on their
own, but they allow cities to act more efficiently and fairly.
Cities can turn housing data into a shared civic good by using a minimal template and dedication to ongoing upgrading, this will help to build a better home, a resilient community and a more responsible government.
Also Read: A New Lens on Housing Affordability and Market Behaviour Australia





-ySWGlp0vgc.jpg)



-3dkuLgKhRD.jpg)








LEAVE A REPLY